
Maps
Maps (Map Coponent)
The Maps object allows you to add interactive geographic maps to your projects. It supports various providers such as Google Maps, OpenStreetMap, and Bing Maps.
Its most important feature is the ability to work offline and to place live SCADA controls (Buttons, LEDs, Gauges, etc.) directly onto the map. This allows you to monitor geographically dispersed facilities (water wells, power transmission lines, pipelines, etc.) from a single center.
Key Features and Working Principle
- Offline Use: Once you open a region on the map, this data is saved to the computer’s cache. Even if the internet connection is lost later, these regions will display without issues.
- Multi-Provider: You can change the map source (Google, Bing, OpenStreet, etc.) via the Advanced panel or dynamically via script during Runtime.
Properties Panel – Key Properties
This panel is used to synchronize the map’s location and zoom level with the PLC or operator.
Value
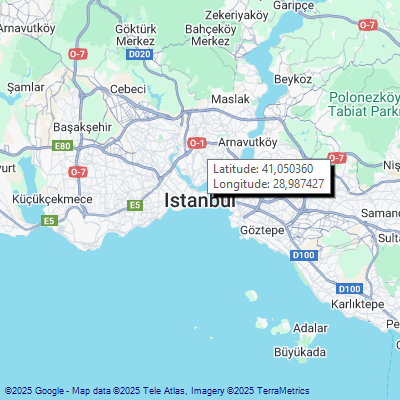
- Latitude (Tag): The tag holding the Latitude information of the map center.
- Longitude (Tag): The tag holding the Longitude information of the map center.
- Zoom (Tag): The tag controlling the zoom level of the map.
- Bidirectional Operation: If you write a value (e.g., 15) to this tag, the map zooms to that level. If the operator zooms using the mouse wheel, the tag value updates automatically.
Advanced Panel – Key Properties
This is the panel where you manage the behavior of the map and the markers upon it.
1. GMap.NET.Settings (Location and Source)
- Provider
- Select the map provider (GoogleMap, OpenStreetMap, BingMap, etc.).
- Latitude / Longitude
- The default (starting) center coordinates of the map.
- ApiKey
- Some providers (e.g., Google, Bing) may require an API key to fetch map data. You can enter your key here.
2. GMap.NET.Object (Markers and Areas)
- Markers (Collection)
- Used to add fixed icons (Pins, Flags, etc.) to the map.
- Events (OnMarkerClick)
- Scripts can be written to perform an action (e.g., opening a detail window) when a Marker is clicked.
- Polygons (Collection)
- Draws polygons to color a specific area on the map (e.g., Factory grounds).
- Transparency Tip: When selecting a FillColor, you can add an Alpha (Transparency) value to the beginning of the color code (ARGB).
- Example: Instead of 100;100;100 (Solid Grey), if you write 50;100;100;100, it becomes 50% transparent grey, allowing the map to show through.
- Routes (Collection)
- Used to draw a path or line between two points (Pipelines, etc.).
3. Behavior Settings
- CanDragMap
- Determines whether the operator can drag the map with the mouse.
- MouseWheelZoomType
- Selects the center point for zooming with the mouse wheel (MousePointer or MapCenter).
Adding SCADA Controls to the Map
The most powerful aspect of the Maps object is the ability to place standard SCADA objects (Buttons, Gauges, Panels) on top of it.
- Adding an Object
- Drag and drop any control (e.g., AlarmView or Symbol) onto the map.
- Fixing Location (Via Tag)
- You must enter coordinate data into the object’s Tag property (or a special field like UserData) in the following format:
- Format: {Lat=41.48389, Lng=28.93249}
- Result: When this definition is made, the object is “pinned” to that coordinate. No matter where you pan the map, the object remains at that specific geographic point.
Important Note: If this Tag value changes during Runtime, the object does not move to the new location automatically. This only determines the object’s initial (Load) position. To move the object during Runtime (e.g., Vehicle tracking), you must use a script.
Tip: Visibility Management Based on Zoom Level
In projects with many locations, objects can overlap and create clutter when the map is zoomed out.
Solution: Manage the Visible property of objects using the map’s Zoom tag.
- Method (Via Tag)
- Bind a condition tag to the object’s Visible property (e.g., ZoomLevel > 10).
- Example Scenario
- In a water network project, only “Depot” icons appear on the general map (Zoom < 10). When zoomed in (Zoom > 12), the “Pump Status” and “Pressure Values” (controls inside a Panel) next to the depot become visible.