
Reports
Reports
The Reports module is used to list, analyze, and export data collected by the SCADA system based on specific criteria. This feature enables users to review historical process data, perform performance evaluations, and monitor system behavior to support decision-making processes. The system provides reporting capabilities for various data types such as measurement values, alarm records, operator actions, production data, and energy consumption.
Users can quickly access the desired data by filtering based on date range, station, device, or variable.
This section explains, step by step, how to create reports, use filtering options, save report outputs, and perform export operations.
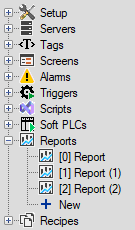
Report Management and Creation
To create a new report, use the New option under the Reports main heading in the Project Tree on the left.
Each newly created report is automatically added to the list with a default name (e.g., Report, Report (1)).
If desired, you can rename the report by modifying the Symbol column in the main Reports window, giving it a meaningful name.
Report List
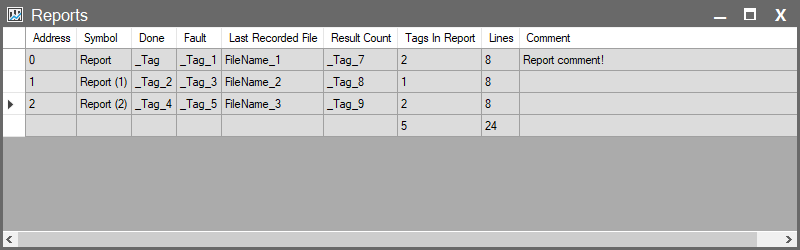
The main report list window displays all reports created in your project. This window provides the following information for each report:
| Parameter | Description |
| Address | The unique ID number of the report within the system. |
| Symbol | The user-defined name of the report. This name also appears in the Project Tree. |
| Done | Indicates whether the most recent report execution (SQL query execution and file generation) completed successfully. |
| Fault | Indicates whether an error occurred during the most recent execution (such as SQL error or file-writing failure). |
| Last Recorded File | Displays the name of the output file generated during the last successful execution (e.g., Report_20251023.pdf). |
| Result Count | Shows how many records were returned from the database the last time the SQL query was executed. |
| Tags in Report | Shows the total number of tags used within the SQL query of the report. |
| Lines | Displays the total number of lines written in the report’s SQL query editor. |
| Comment | User-added notes or descriptions related to the report. |
Status and Error Indicators
The Reports module provides visual feedback regarding database connections, trigger-related tags, and the status of SQL queries.
If the Reports node in the Project Tree or any row in the list appears red, there is a fundamental issue preventing the report from running.
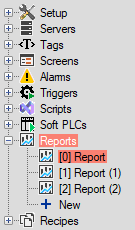
1. “-1” Value in the Lines Column (Query and Compilation Error)
The Lines column typically shows an estimate of the number of result rows returned by the report.
If this column displays “-1”, it means:
The report was newly added or modified, but not yet compiled. Click the Compile button to compile the report.
If the SQL query contains errors, correct them before compiling again.
2. Missing Definitions
If the Reports heading or any row is highlighted in red, it indicates a critical missing configuration blocking report execution. Possible causes:
Screen, Panel, or Chart Missing: The screen, panel, or chart object defined as the report’s output target has been deleted or is incomplete.
Database Error: The database connection from which the report fetches data is empty or has been deleted.
3. In-Cell Warnings (Invalid Tag/Connection)
If a warning icon appears in any parameter field:
- The selected tag or database connection has been deleted from the project or the tag’s data type has been modified.
- Solution: Define a new tag or update the existing tag selection.
Related Topics
To fully utilize the Reports module, it is recommended to review the following topics:
Report Editor
- The main interface where all detailed settings of a report are configured. This includes writing and compiling the SQL query, executing the report, and configuring output options such as database selection, chart settings, Excel/PDF export, logo insertion, etc.
- Advanced guidance and practical scenarios on how to use SCADA tags as dynamic values inside standard SQL queries (e.g., WHERE TagValue > 100).