
Chart
Chart (Graph and Trend Analysis)
The Chart (Trend) object is an analysis component used to visualize real-time or historical data points collected from the field.
The Chart object does more than just drawing lines; it includes advanced features such as historical querying from the database, instant moving trend monitoring, XY analysis, and data export.
Basic Configuration: Chart Type
The most fundamental setting that determines the operating logic of the graph is the ChartType property in the Advanced panel.
1. RealTime (Moving Graph)
- Operational Logic: Data flows from right to left (similar to an oscilloscope). As the X-axis value (Time or Number) increases, the graph automatically shifts to the right.
- Data Source: Receives instant values directly from the PLC or internal tags. It does not use the database.
- X-Axis: Usually bound to the System.Now (Time) tag. However, a numeric tag can also be used; in that case, the graph advances as the number increases.
- Min/Max Behavior: In this mode, Min/Max values determine the “Visible Window Width” of the graph.
- Example: If Min=0 and Max=60 (Width is 60 units). When the X value exceeds 60 (e.g., becomes 61), Max automatically becomes 61 and Min becomes 1. The 60-unit window shifts to follow the data.
2. Historical (Historical Data Analysis)
- Operational Logic: Retrieves data saved in the database and displays it statically. This is the most complex structure.
- Data Source: Uses the project’s database settings. It is based on the TimeStamp column or a specific X Tag column in the database.
- Optimization (Smart Data Fetching): When very wide date ranges (e.g., 1 year of data) are selected, the system does not attempt to fetch millions of rows, which would freeze the system. Instead, it fetches data proportional to the pixel width of the screen. Data is automatically averaged or summarized based on the graph’s resolution.
- Zoom: When the operator zooms into the graph, the system sends a new query to the database to fetch detailed data for that narrow range. At this point, the averaging rule is disabled, and raw data is displayed.
3. XY (Cartesian Graph)
- Operational Logic: Independent of time. It plots the change of one variable (Y) against another variable (X) point by point (e.g., Torque vs. Speed curve).
- Persistence: The XY graph is temporary. Points drawn remain on the screen as long as the screen is open. The graph resets when the screen is closed and reopened.
- Drawing: A new point is added to the graph every time the X tag changes, and the points are connected by lines.
Properties Panel – Key Properties
Value
- X Axis Tag:
- The tag that controls the horizontal axis (Time or Value).
- RealTime/Historical: Usually System.Now is selected.
- XY: The numeric tag that will vary on the X-axis is selected.
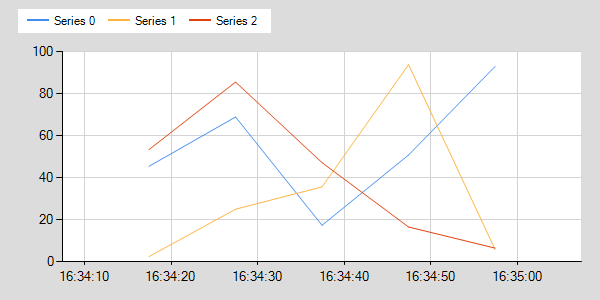
- Series 0… (Series):
- The values to be plotted on the Y-axis (Vertical) (Temperature, Pressure, etc.).
- Minimum / Maximum:
- For X-Axis: These values can be provided dynamically via a tag.
- Working Principle: These values actually set the “X-Axis Length” (Window Size).
- RealTime Example: If Min: 10 and Max: 100 are set, the axis length is 90 units. When the current X value reaches 1000, the window shifts so that Min becomes 910 and Max becomes 1000.
Advanced Panel – Key Properties
This is the main panel where you manage the behavior, performance, and visual details of the Chart object. Settings are categorized for ease of use.
Custom
This category determines the graph’s operating logic and the permissions the operator has during Runtime.
- ChartType
- Selects the operating mode of the graph (Realtime, Historical, XY).
- ExportMenu
- Function: Determines whether the “Export” menu appears when the graph is right-clicked during Runtime.
- Options: If set to True, the operator can instantly save the graph to their computer in PDF or Excel format.
- Sampling Mode
- Determines the optimization method applied when drawing data. This significantly impacts performance during intense data flow.
- Real: Draws every incoming point without skipping. Highest detail level but may tax the processor.
- MinMax: Draws the highest and lowest values within a specific pixel range. Increases performance while preserving the general shape of the trend. (Default and Recommended).
- Average: Draws the average of the data. Ideal for smoothing noisy (fluctuating) signals.
- SeriesMenu
- If True, the operator can right-click to open the “Series” menu.
- ZoomMenu
- If True, the operator can select an area on the graph with the left mouse button to Zoom In.
Chart (Graphics)
This section contains detailed settings for the sub-components (Lines, Axes, Titles) that make up the graph structure. Click the (Collection) button next to each row to open the details window.
- Series
- Where you determine the color, thickness (BorderWidth), and drawing type for each data line (Series 0, Series 1…).
- ChartType: Changes the line style. Options like Line (Straight), Spline (Curved/Smoothed), Step, or Column are set here.
- ChartAreas
- Contains settings for the background color, Grid Lines, and X/Y axes configuration.
- AxisX / AxisY: Font size, number format (Decimal places, etc.), and intervals are managed here.
- Legends
- Sets the position (Bottom, Top, Right) and font of the box showing which color represents which data.
- Titles
- Used to add a fixed title to the top of the graph, such as “Furnace Temperature Analysis”.
Appearance and Image
Determines the general theme and quality of the graph.
- Palette
- Sets the color theme of the graph (e.g., BrightPastel, Fire, SeaGreen). Provides professional color harmony without selecting colors individually.
- AntiAliasing
- Softens the edges of lines and text to prevent a “jagged” appearance. Setting to All or High is recommended.
- BorderSkin
- Adds a stylish frame or embossed effect around the graph.
Summary: Which Type Should I Choose?
| Need | Recommended Type | Example Scenario |
| Instant Monitoring | RealTime | Monitoring current furnace temperature fluctuations, similar to a heart rate monitor. |
| Past Analysis | Historical | Examining the database to answer “Why did production stop last night?” |
| Correlation Analysis | XY | Plotting how a motor’s Torque (Y) changes relative to its Speed (X), independent of time. |