
Network Window
Network Window (Driver and Tag Management)
This window, which opens when you click on a protocol (e.g., [1] Network) in the project tree, is the main control center where SCADA communicates with the outside world.
This interface consists of three main sections:
- Left Panel (Tree Structure): The hierarchy of the protocol and the devices under it.
- Bottom Panel (Connection Settings): Physical connection parameters (IP, Port, etc.) of the selected protocol or device.
- Right Panel (Tag List): The table defining the data to be read from the PLC or device.
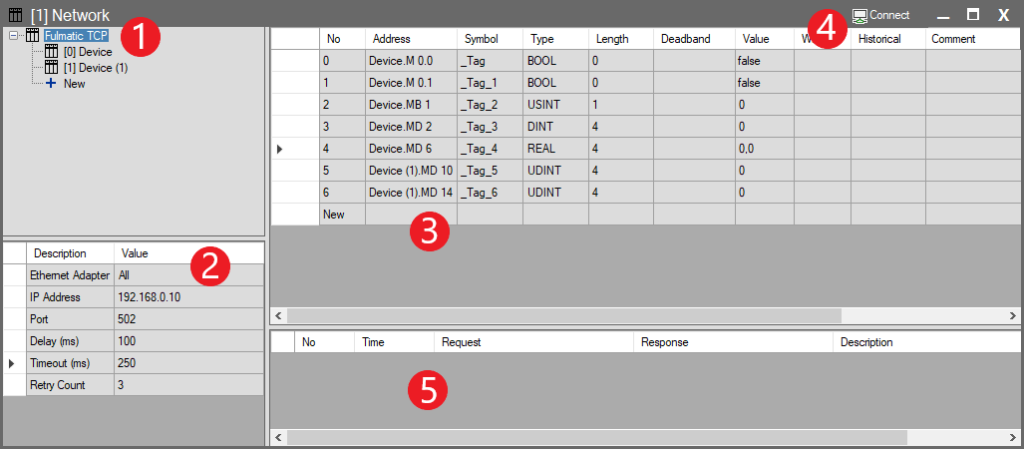
1. Tree Structure: Network and Device Logic
This section allows you to organize your communication line physically or logically.
- Network (Protocol): Represents the communication driver itself (e.g., Modbus TCP). It corresponds to the physical port (Ethernet card or COM port) on your computer.
- Device (Station): Represents a physical PLC or a data group on that network.
Usage: Right-click on the tree and select New to add multiple Devices under the same Network. Example: If there are 10 different energy analyzers on an RS485 line (Network), a separate Device is created for each one.
2. Connection Settings
When you select a protocol (Network) from the tree structure, the physical connection parameters for that driver are displayed in the bottom-left panel.
Important Note: This panel is dynamic. The settings here change based on the protocol you select (Ethernet, Serial, OPC, etc.). The table below describes the standard TCP/IP (Ethernet) based connection settings shown in the interface.
| Parameter | Description |
| Ethernet Adapter | Selects which network card (Wi-Fi, Ethernet, etc.) on your computer will be used for communication. All: Uses Windows’ default network route (Recommended). |
| IP Address | The IP address of the PLC or device to connect to on the network (e.g., 192.168.0.10). |
| Port | The communication port of the device. (e.g., Standard 502 for Modbus TCP and Fulmatic TCP). |
| Delay (ms) | Query Delay: The minimum time SCADA waits between two requests sent to the device. Used to balance network traffic and prevent overloading the device. |
| Timeout (ms) | The maximum time to wait for a response from the device after sending a request. If this time expires, the request is considered failed. |
| Retry Count | Determines how many times the system will retry the operation before switching to “Fault” status if the connection is lost or a Timeout occurs. |
Protocol-Specific Settings
If you are using a Serial Port (RS485/232 – Baudrate, Parity, etc.) or brand-specific settings like Siemens/Omron (Rack, Slot, Node Address), please refer to the detailed guide for the relevant driver.
- See: Protocol Guides Page
3. Tag List
When the top heading in the tree structure is selected, all tags are displayed as a single list in the right-hand tag list panel. When a specific Device is selected in the tree view, only the tags communicating with that device are listed.
.
| Column | Description |
| No | The sequence number of the tag in the list. For informational purposes only. |
| Address | Address information indicating the source of the tag. Content varies depending on whether it is Internal or a Power Tag. |
| Symbol | The unique name of the tag within the project. This is the name used to access this tag in screens, alarms, and scripts (e.g., Motor_Speed, Start_Button). |
| Type | The data type of the tag (BOOL, INT, REAL, STRING, etc.). Determines how the tag is stored in memory. |
| Length | The space the tag occupies in memory (in Bytes). For the STRING data type, this indicates the maximum number of characters that can be stored (e.g., 32). |
| Deadband | The minimum difference (Tolerance) required for the value to be considered “changed.” Prevents unnecessary processing due to minor noise. |
| Value | The current live (real-time) value of the tag. |
| Write | The field used to manually write a value to the tag. |
| Historical | Manages historical data recording settings. Clicking this cell opens the recording window.For more information, visit the Historical Tags page. |
| Comment | An explanatory note entered by the user regarding the tag. |
4. Toolbar and Connection Control
Located in the top right corner of the window, this section allows you to instantly test the driver you configured and monitor the communication cycle.
- Connect / Disconnect Button
- Starts or terminates the active connection with the device using the IP, Port, or Serial Port information entered in the “Connection Settings” panel.
- Note: This button is not visible on the Internal tag page; it is active only for external protocols like Modbus, Siemens, etc.
- Communication Bar
- When the Connect button is pressed and the connection is established, a green bar to the left of the button begins to fill and empty (Animation).
- This animation indicates that SCADA is running continuously in the background and the query cycle is alive. The movement of the bar means the driver is active.
5. Communication Traffic and Log Panel
This panel at the bottom of the screen is a “Debugger” tool that displays the raw data traffic (Request/Response) between SCADA and the Device (PLC) in real-time. The rows here detail the result of each query cycle.
- Color-Coded Status:
- Green Rows: Represent successful communication. A query was sent, and a valid response was received.
- Red Rows: Represent an error state. In cases of Timeout, disconnected cable, or incorrect addressing, the rows turn red, and the error description is written.
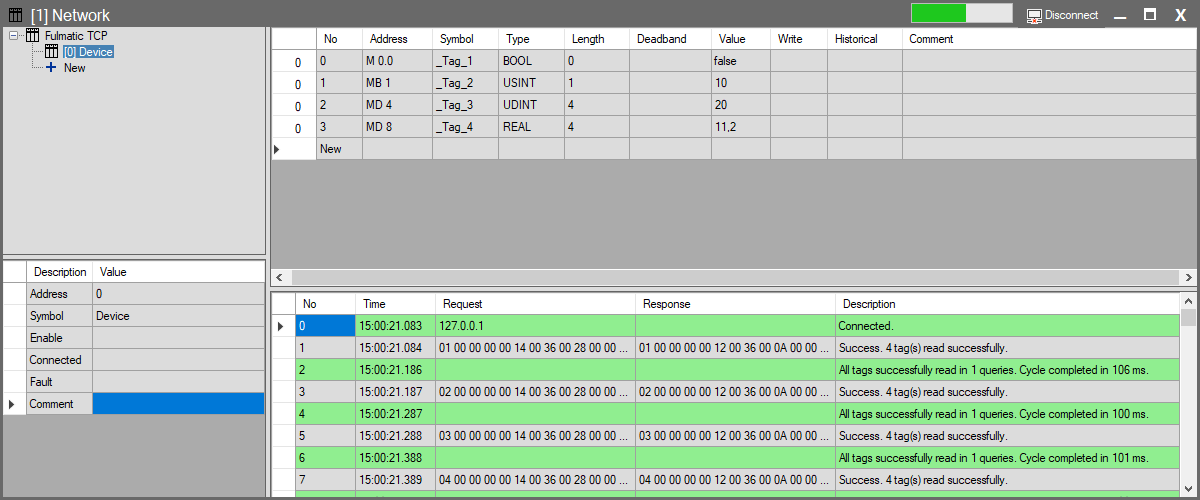
Column Descriptions:
| Column | Description |
| Time | Timestamp (time and milliseconds) of the operation. Used to analyze the communication period. |
| Request | The raw (Hex) data packet sent from SCADA to the PLC. (e.g., 01 03 00… Modbus query). |
| Response | The raw (Hex) response packet returned from the PLC to SCADA. |
| Description | Human-readable summary of the operation. • Example: “Success. 4 tag(s) read successfully.” • Performance: You can also view performance data here, such as “Cycle completed in 106 ms”. |