
Servers
Servers
The Servers page acts as the gateway of your Wise SCADA project to the outside world. With this configuration, you can define your project as a data provider (Server), allowing third-party software or other Wise SCADA clients (Client) to connect to your system to read or write data.
Configuration Parameters
The following table provides detailed descriptions of the parameters used when creating a server.
| Parameter | Description |
| No | The sequence number of the server definition in the system. |
| Symbol | The name given to the server connection. This name is used in log records and error messages. |
| Protocol | Determines the communication standard the server will use: • Wise SCADA, Modbus, WebSocket, HTTP (JSON / XML / Plaintext), Custom: JSONFor detailed configuration of protocols, see: Server Communication Protocols |
| Allow All IPs | Security Warning: When this option is checked, security restrictions are lifted, and any device (IP) on the network is allowed to connect to this server. |
| Allowed IPs | If “Allow All IPs” is not selected, security is enabled. Only connection requests from the IP addresses written in this field are accepted. (e.g., 192.168.0.50; 192.168.0.55) |
| TCP Port | The port number to be listened to for TCP communication (Default: 8000). |
| UDP Port | The port number to be listened to if UDP communication is used. |
| Write Access | Allows connecting clients to modify data. • Checked: The Client can perform both reading and writing (Read/Write). • Unchecked: The Client can only monitor (Read-Only) and cannot change values. |
| Tag List | Determines the data packet the server will expose to the outside. • All Tags: All tags in the project become accessible. • Custom List: The Tag Synchronization window opens, and only permitted tags are selected. (See: Tag Synchronization Standard) Note: In projects containing a large number of tags, it is recommended to select only the necessary tags instead of ‘All Tags’ to avoid burdening network traffic. |
| Event Recording | Determines whether events occurring on the server will be recorded in the system logs. |
| Activate Listener | Switches the Server to “Listening Mode”. When the button is pressed, the server becomes active and starts accepting incoming connections. |
| Listening | (Status Indicator) Shows whether the Server is currently active. |
| Fault | (Status Indicator) If an error occurs during connection (e.g., Port conflict), error information is displayed in this field. |
| Responded IP | (Status Indicator) Shows the IP address of the device currently connected to the server and exchanging data. A STRING type tag can be defined here. |
| Comment | A description field where the user can take private notes regarding this server definition. |
Diagnostics
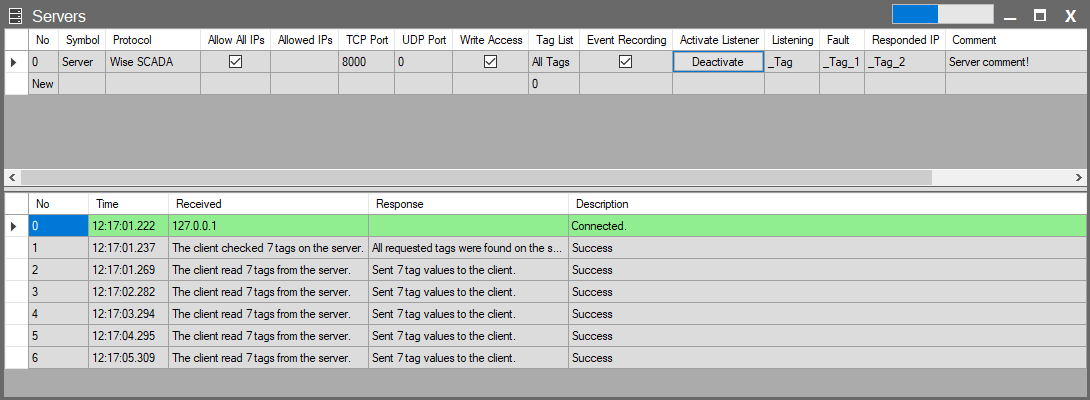
When the “Activate Listener” button is pressed, a real-time communication panel opens at the bottom of the screen. This panel is used to monitor the instant status of the SCADA server, connected clients, and data traffic.
- Green (Connected): Indicates a new and successful client connection has been established.
- Gray (Information): Standard data exchange (Read/Write requests).
- Red (Error): Indicates errors.
| Column | Description |
| No | The transaction sequence number. |
| Time | Shows the time the event occurred (with millisecond precision). |
| Received | Shows the request coming to the server. • Connection: The IP address of the connecting device (e.g., 127.0.0.1). • Data: The request message from the client (e.g., “The client read 7 tags…”). |
| Response | Shows the response the server gave to this request. • When data is sent: “Sent 7 tag values to the client.” • In case of error: Error code or description. |
| Description | Summarizes the result of the operation (e.g., Success or Fail). Green rows represent successful connections, while red rows represent errors. |