
Report Editor
Report Window
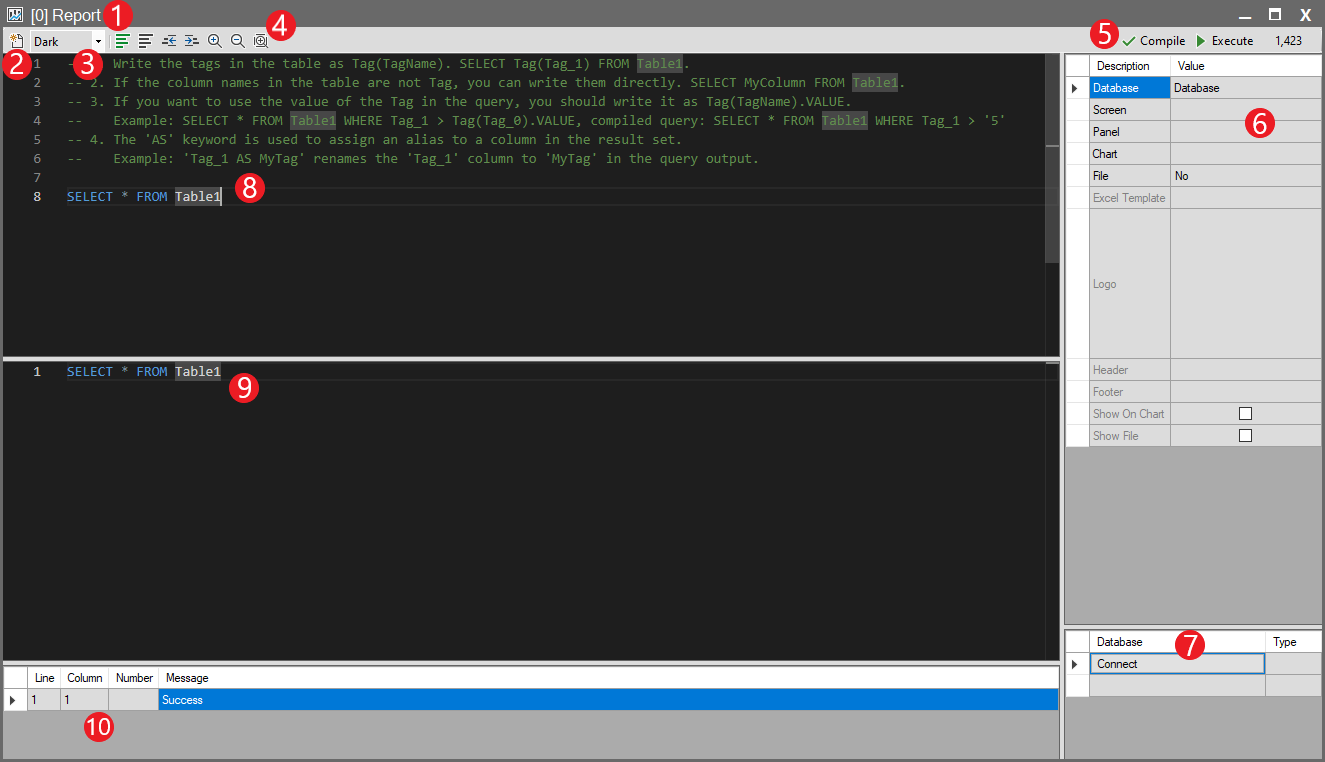
Editor Components
1. Title Bar
- Displays the name of the currently opened report. (Example: [0] Report)
2. Reset Button
 |
Reset Button |
Resets any changes made in the SQL query editor. |
3. Theme
- Allows switching between Dark and Light themes.
4. Editor Toolbar
 |
Comment Out Selected Code |
Converts selected lines into comments (//). This allows disabling code without deleting it. |
 |
Uncomment Selected Code |
Removes the comment markers (//) from selected lines and reactivates the code. |
 |
Decrease Code Indentation |
Reduces the indentation level of selected lines by shifting them to the left. |
 |
Increase Code Indentation |
Increases the indentation level of selected lines by shifting them to the right. This improves code readability. |
 |
Zoom In |
Increases the text size in the code editor. |
 |
Zoom Out |
Increases the text size in the code editor. |
 |
Zoom To Fit |
Automatically adjusts the text size so the content fits the width of the code editor window. |
5. Control Buttons
 |
Compile |
Compiles the SQL query you have written. |
 |
Run |
Executes the SQL query. |
Execution Time: Displays the time (in milliseconds) required to compile or run the query.
Note: The compile time is not an indicator of runtime performance.
6. Output and Display Settings
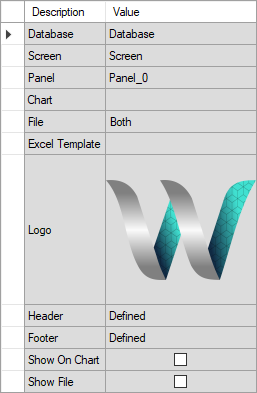
Database: Select the database to be used for the report.
Screen: If you want to display report results on a screen, select the target screen here. When this is selected, you must specify at least one Panel or Chart object.
Panel: Specifies the panel object in which the report data will be shown in table or list form on the screen.
Chart: Specifies the chart object on the selected screen where the report data will be displayed graphically.
File: Defines the output format for the report. Options: Excel, PDF, or Both.
Excel Template: If you want to use a custom Excel template, select the template file here. Report data will be inserted into the sheet named Sheet1.
Logo: Select the logo to be used in the PDF output.
Header: Opens the Condition Dialog window to add and edit the header for the PDF report.
Footer: Opens the Condition Dialog window to add and edit the footer for the PDF report.
Show on Chart: Includes the chart containing the report data inside the PDF output.
Show File: Automatically opens the generated Excel or PDF file immediately after the report is created.
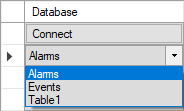
7. Database Connection Tools
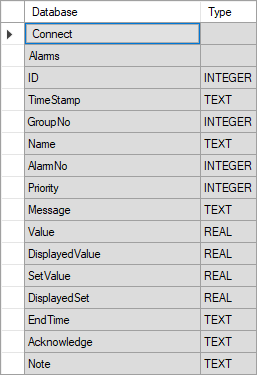
The Connect button tests the connection to the target database.If the connection is successful, all available tables and fields (columns) in the database will be listed below.
The Type column displays the data types of the listed fields.
8. SQL Query Input Area
- This is the main editor area.
- Write the SQL query required to retrieve data for the report. (Example: SELECT * FROM Table1)
9. Compiled Query / Preview Area
- This section displays the final SQL query generated after the Compile operation.
- Any automatic corrections or system adjustments to the query are also shown here.
10. Query Result Table and Status Section
- This area lists the results of the executed SQL query in table format. When the query runs successfully, the retrieved data appears here.
- If the query contains an error (syntax error, etc.), the error details — Line, Column, and Message (e.g., “Success”) — are displayed in this area.